> ## Documentation Index
> Fetch the complete documentation index at: https://bun-1dd33a4e-farm-d3f3c56f-import-meta-hot-for-bun-hot.mintlify.site/llms.txt
> Use this file to discover all available pages before exploring further.
# Inspect memory usage using V8 heap snapshots
Bun implements V8's heap snapshot API. Use it to capture the heap at runtime and debug memory leaks in your JavaScript/TypeScript application.
```ts snapshot.ts icon="https://mintcdn.com/bun-1dd33a4e-farm-d3f3c56f-import-meta-hot-for-bun-hot/B1HU0ph4qZFBSiAj/icons/typescript.svg?fit=max&auto=format&n=B1HU0ph4qZFBSiAj&q=85&s=7b34f4a33519938000740b4c2a95611f" theme={"theme":{"light":"github-light","dark":"dracula"}}
import v8 from "node:v8";
// Creates a heap snapshot file with an auto-generated name
const snapshotPath = v8.writeHeapSnapshot();
console.log(`Heap snapshot written to: ${snapshotPath}`);
```
***
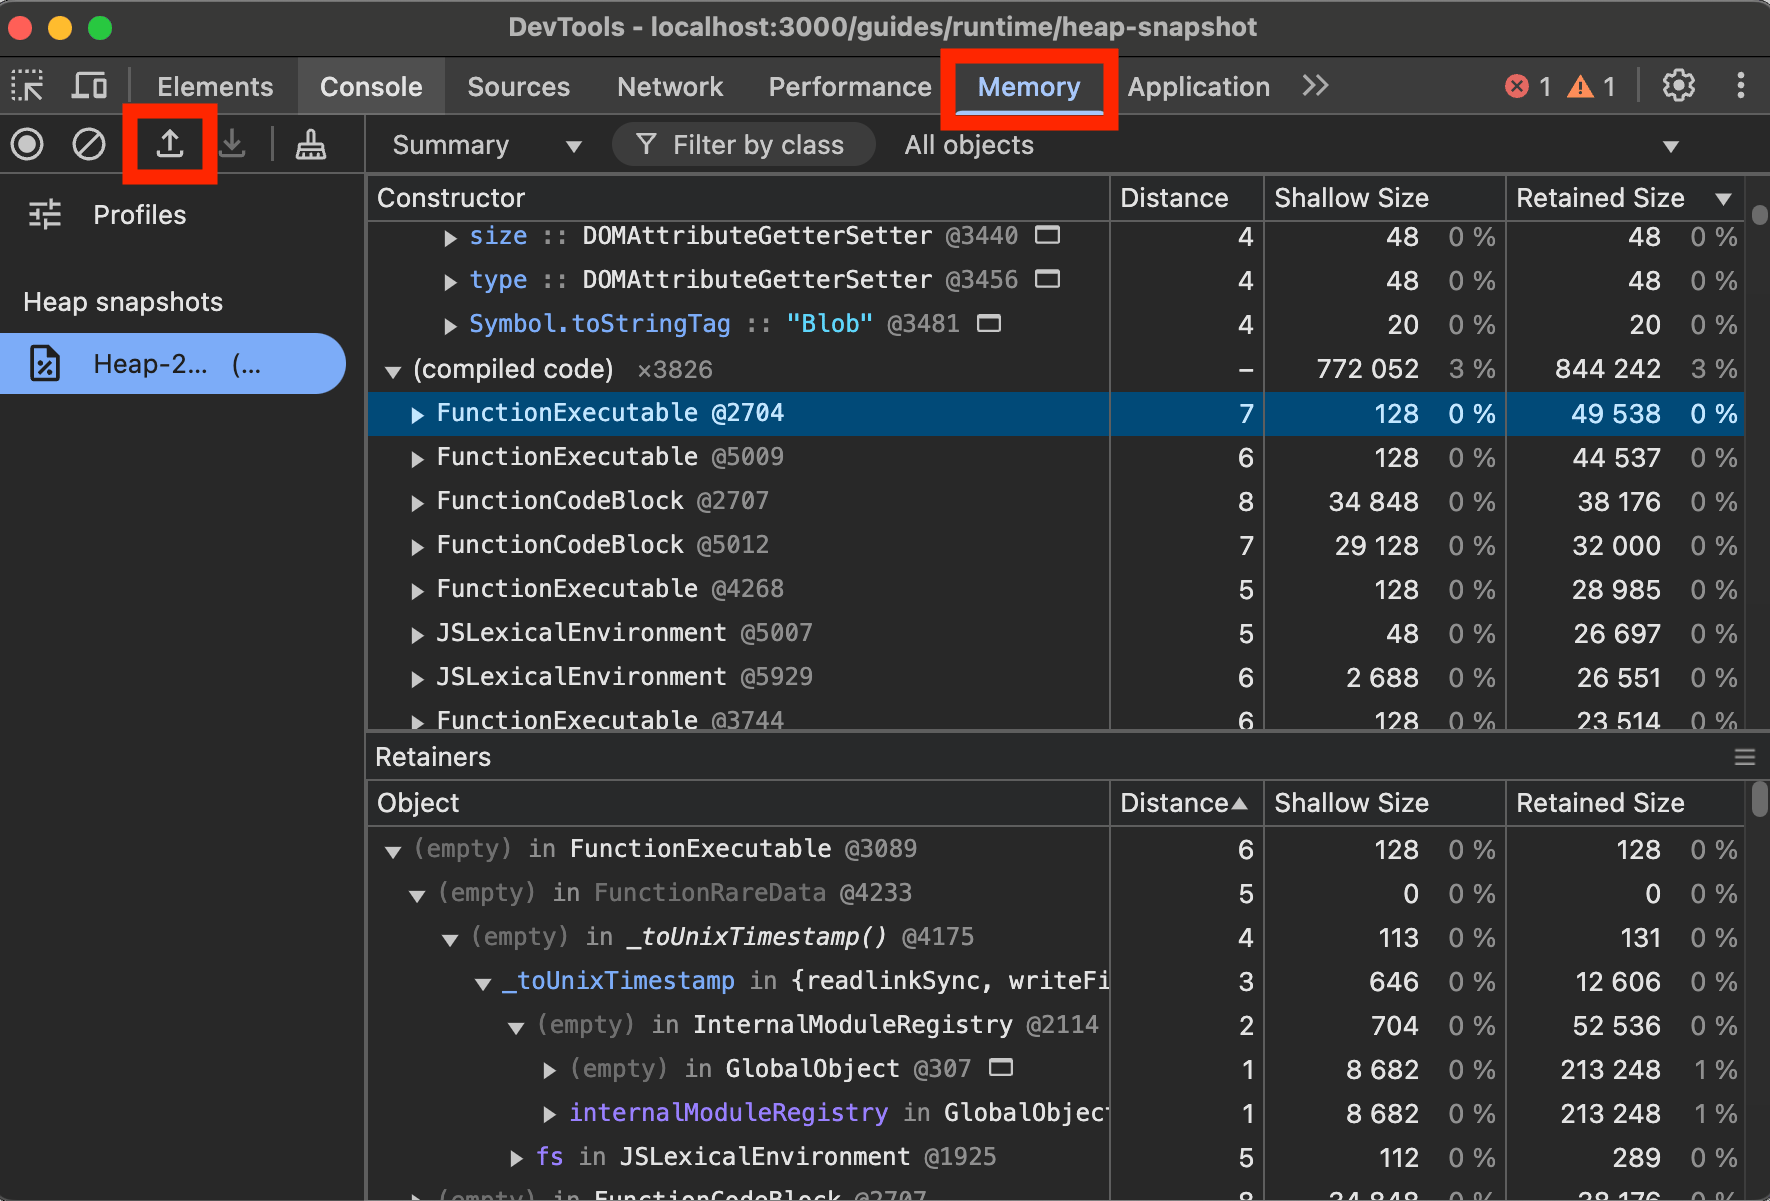
## Inspect memory in Chrome DevTools
To view V8 heap snapshots in Chrome DevTools:
1. Open Chrome DevTools (F12 or right-click and select "Inspect")
2. Go to the "Memory" tab
3. Click the "Load" button (folder icon)
4. Select your `.heapsnapshot` file